|
Severe Weather Type |
Average Number of Annual Occurrences |
| Hail |
55 |
| Damaging Winds |
95 |
| Hurricanes |
1 every 4 years |
| Tornadoes |
27 |
| Tropical Systems |
3 every 2 years |
|
Characteristic |
Median |
|
Hail diameter (in) |
1.0 |
|
Damaging wind gust (mph) |
60 |
|
Tornado path length (mi) |
1 |
|
Tornado path width (ft) |
120 |
|
Fujita Scale Rating |
1 |
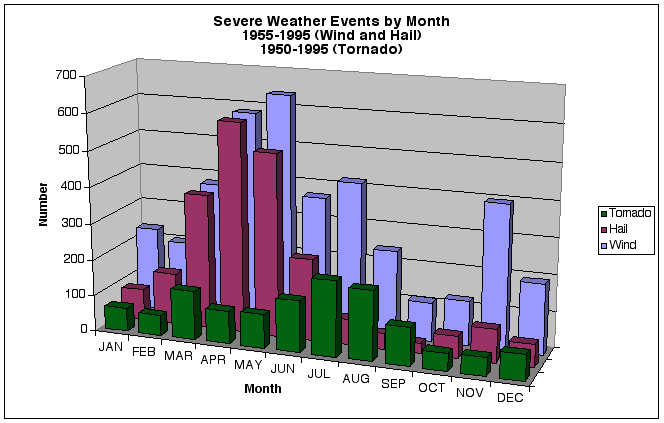
Tornadoes are most likely to occur late in the summer with minor peaks in
March and December. Other forms of severe weather are more likely to occur
during the spring months, with April the most likely month for hail and May the
most likely month for high winds. November, however, shows a secondary
maximum both for hail and high winds.
As the figure below shows, most severe weather occurs in the
afternoons, with peak hours ranging from 3 PM for tornadoes to 4 PM for high
wind events to 6 PM for hail storms. Minor peaks occur during the early to
late morning hours, varying from 1-2 AM for hail to 4 AM for high winds to 11 AM
for tornadoes.
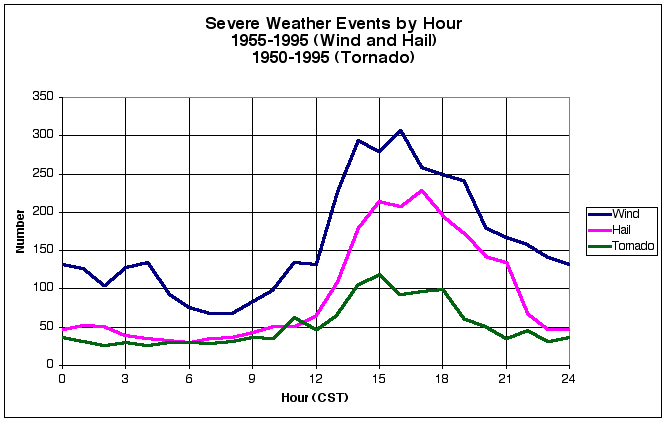
Total number of severe weather
events per hour, by type.
The source of data is the Storm Prediction Center of the National Weather
Service
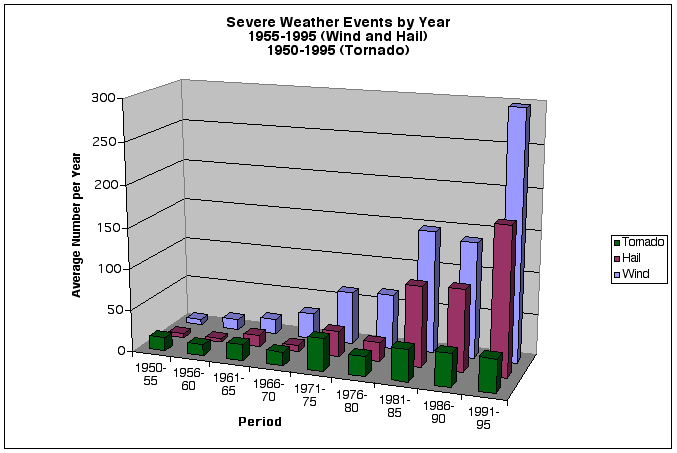
As the figure below demonstrates, reports of severe weather in Louisiana have
been increasing since the 1950's. Especially dramatic are the increases in
reports of hail and high winds beginning in the 1980's. While climate
changes may be responsible for some of this increase, the rather sudden changes
that occurred from 1981 to 1995 suggest that two other factors are probably more
important. First, population in the state is increasing and people have
become increasingly aware of the weather, so there is a greater likelihood that
someone will observe a severe weather event and report it. Second, the
observational capabilities of the National Weather Service have improved because
of the increased sensitivity in spatial and temporal resolutions and in
magnitude of the Doppler weather radars and the increased number of surface
observations.