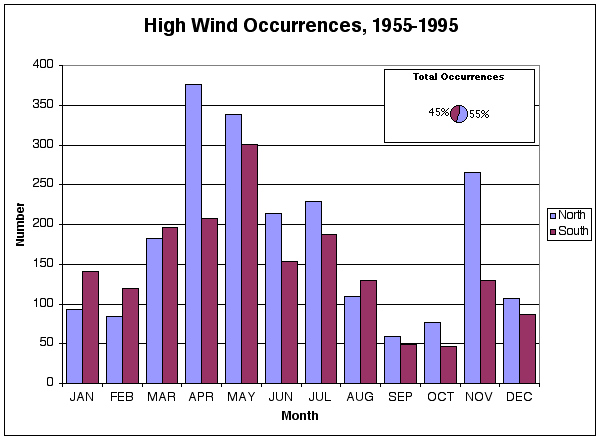
Total number of damaging-wind reports in Louisiana by month for the
northern (latitude > 31¡ N) and southern
(latitude <= 31¡ N) parts of the state.
Data source: Storm Prediction Center of the National Weather Service
High wind events not associated with tornadoes are the most frequently occurring severe weather in Louisiana. Although 75% of the reported wind events had gusts less than 67 mph, one event (9 May 1956 in Tensas Parish) had a reported gust of 111 mph. As can be seen from the inset in the figure below, the distribution of damaging wind events is fairly uniform between the northern and southern parts of the state. A distinct cycle throughout the year is also evident and changes slightly between the two regions. Both regions have primary maxima in the spring but the peak month for the northern parishes is April while it is May for the southern parishes. In the south, secondary peaks occur during November and January. In the north, a very strong secondary peak occurs in November.
Total number of damaging-wind reports in Louisiana by month for the
northern (latitude > 31¡ N) and southern
(latitude <= 31¡ N) parts of the state.
Data source: Storm Prediction Center of the National Weather Service
Damaging winds in Louisiana tend to occur most often during the afternoon hours, with the peak occurrence in the northern parishes at 4 PM and at 2 PM in the southern parishes. Secondary maxima occur during the nighttime hours with peaks at midnight and 3 AM in the north and at 11 PM and 4 AM in the south. Once again, the diurnal nature of thunderstorms, the source for most damaging winds, would appear to explain the overall pattern evident here. Nocturnal peaks may be associated with mesoscale convective systems.
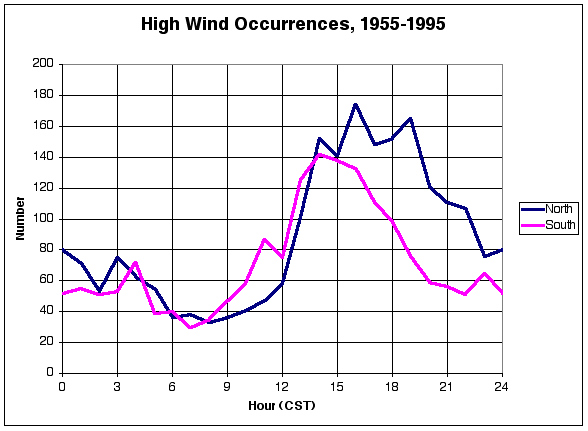
Total number of damaging wind reports by hour of the day for the northern
(latitude > 31¡ N) and southern
(latitude <= 31¡ N) parts of the state.
Data source: Storm Prediction Center of the National Weather Service
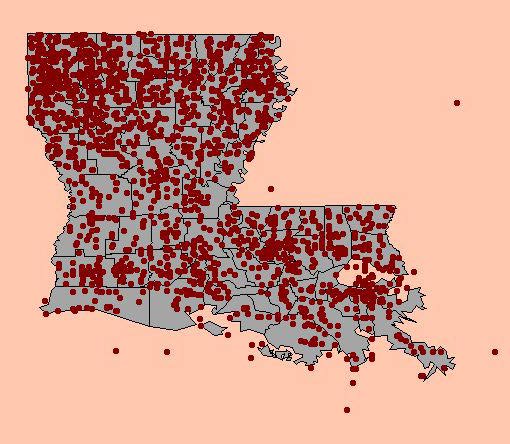
The average number of damaging wind events per year, normalized to a 1000 sq. mile area, has been computed for each parish. The spatial distribution of this variable or of individual wind events can be viewed using ESRI's Internet Map Server (IMS) running at ULM. For a brief description of how to use the tools in IMS, click here.
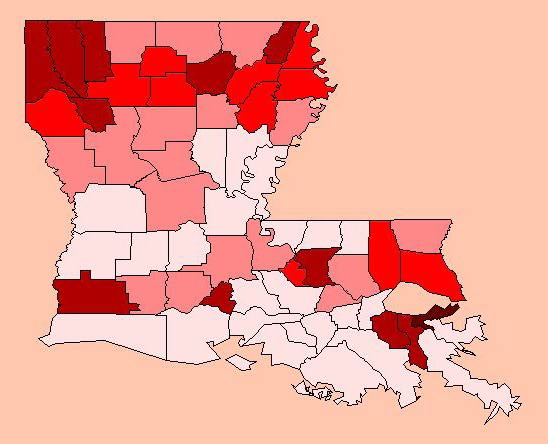
As indicated above, hail events tend to occur more often in northern Louisiana than in the southern part of the state. To view the map of the average number of damaging wind events per year per 1000 sq. miles, click here or on the image below. The greatest frequency of events (darker colors), however, occurred in Orleans Parish, which averaged more than 10 events per year per 1000 sq. miles. The fewest damaging wind events between 1955 and 1995 occurred in Vermilion Parish, averaging slightly more than 1 event per 1000 sq. miles every two years. As with the tornado occurrences, the spatial distribution of damaging wind events may be biased toward more reports from the population centers along the I-10 and -20 corridors.
To view the map of each damaging wind event, click here or on the image below.